Office for National Statistics Release New House Price Data
The Office for National Statistics (ONS) have released new house price data during the month of May. The data from the ONS is seen to be the most reliable as it is based on actual purchase price figures recorded at the land registry. Unlike other data that we regularly report on from Rightmove which is based on advertised “For Sale” prices, or data from Halifax which is based on mortgage applications The Land Registry data does not come with some of the associated flaws from other indices, which we discuss below in this article.
Summary of The ONS UK House Price Index
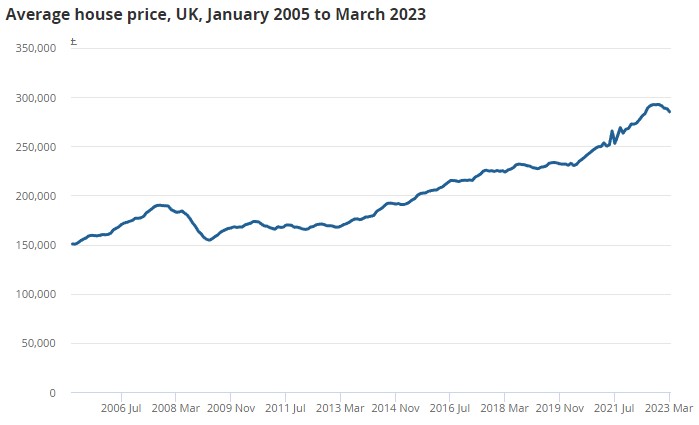
- The data is recorded for sold house prices registered at the Land Registry during March 2023 and was released on 21st June 2023. The next release is 19th July 2023. The full report can be seen here.
- The UK National House Price is £286,000 for April 2023 (Precisely – £286,489 at the Land Registry. Surprisingly we have seen a monthly rise of 0.5% and a yearly rise of 3.5%, previously this was 4.1% so the yearly gains are getting smaller. With the Government struggling to tackle inflation and further raising the base rate to 5% it is expected that prices will fall further before the end of the year.
National House Price Across Different Regions of The United Kingdom
| Region | Average House Price (£) | Yearly Growth (%) |
| England | 306,000 | 3.7 |
| Wales | 213,000 | 2 |
| Scotland | 187,000 | 2 |
| Northern Ireland | 172,000 | 5 |
As can be seen from the above table there is a wide range of different averages across different regions that equates for the entire UK national average.
The Difference Between Data from Rightmove and The ONS
Rightmove produce their own house price index each month and we regularly report theses figures on Direct House Buyer as it allows the national house price average to be reported on a monthly basis. The problem with this data is it is based on advertised “For Sale” prices and these are often inflated due to sellers newly listing their property at a optimistic price and also commonly assuming that the house buyer will require a discount. Therefore, the advertised price is quite commonly higher than the “Sold” price that is provided for at the land registry and this clearly can be seen when The ONS have reported the National House Price to be £289,818 in January 2023 and Rightmove reported a figure of £362,438.
The Difference Between Data from Halifax and The ONS
Halifax also report their national house price figures each month and these are calculated on mortgage transaction data. It could be said that these figures are more accurate than Rightmove as they are based on the actual sale price rather than the advertised price but there are still reasons why this is not as accurate as Land Registry data. For example not everyone buys a house using a mortgage and their were 482,000 cash buyers last year which equates to 35% of the market. That’s 35% of people who don’t require a mortgage and the values of property transacted in this way won’t be equated for by Halifax. Furthermore, The mortgage products that Halifax offer may not be so attractive or attainable for a certain amount of the UK population so that’s further data which isn’t accounted for. The most recent May’s Halifax data shows a national house price of £286,532.
Comparison of ONS National House Price Vs Other Indices
The most recent report from The Office for National Statistics is based on figures recorded for March 2023, therefore to make a fair comparison using January’s figures for all indices is the most up to date picture of all the different National House Prices. The table below shows the National House Price recorded for each index during January.
| Index | Average House Price (£) |
| Office for National Statistics (ONS) | 286,000 |
| Rightmove | 372,812 |
| Halifax | 286,532 |
In the above table the disparity between what sellers are asking for and actually achieving can be clearly seen with a 87,885 price difference. Conversely, Halifax show an even lower figure than what was recorded at the land registry and this may show the lack of data that they work with. As mentioned before, Halifax’s figures doesn’t include cash buyers or people who don’t use them for a mortgage.
In summary, all indices can be used as a measure of house price performance but only when they are compared to the previous figures recorded on their own records.